by Nicole Barbato | Updated Jul 1, 2024
If you’re in Facebook Ads Manager often, you’ve probably seen the notice that Relevancy Score is going away and will be replaced with Facebook's new Quality Ranking. This week, we started to see the new metric for a few clients, and a full roll out is planned to take effect by the end of April 2019.
Before we explain what Quality Ranking is on Facebook, let's look at the metric it's replacing: Relevancy Score.
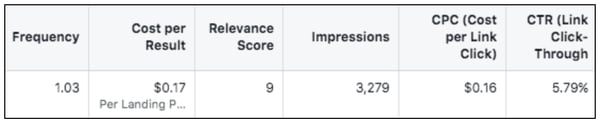
Relevancy Score is a rating from 1 to 10 that estimates how well your target audience responds to your ad. As a Facebook advertiser, you only have insight into this metrics once your ad receives more than 500 impressions. A Relevancy Score of 5 was an average score, and anything lower was an indicator that your ad was not resonating with your selected audience. Generally, a higher Relevancy Score meant you could expect better results like lower cost per click, higher click through rate, etc.
A few factors went into calculating this score, including positive indicators (engagement, clicks, conversions) and negative indicators (hiding posts and not interacting with the ad).
So, what is Facebook's Quality Ranking and how is it different from Relevancy Score?
The new Quality Ranking will actually be broken out into 3 different metrics, an effort on Facebook’s part to give advertisers a better understanding of where exactly their ad is not performing.
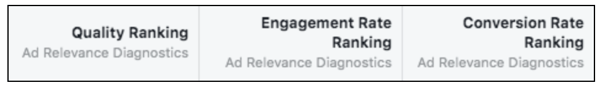
The three metrics will include:
- Quality Ranking: Explains how your ad quality compares to ads competing for the same audience.
- Engagement Rate Ranking: Explains how your ad's expected engagement rate compares to ads competing for the same audience.
- Conversion Ranking: Explains how your ad's expected conversion rate compares to ads with the same optimization goal competing for the same audience.
Both Engagement and Conversion Rankings are not available when running ads for impressions, reach, ad recall lift or custom conversions.
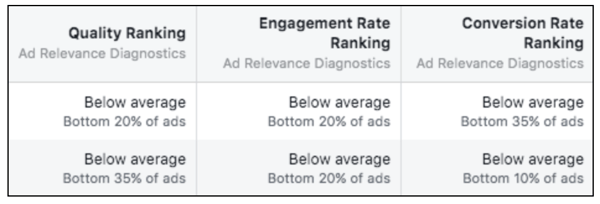
The rankings are broken down into:
- Above Average
- Average
- Below Average (Bottom 35% of ads)
- Below Average (Bottom 20% of ads)
- Below Average (Bottom 10% of ads)
When you are Below Average, or in the bottom 20% that means your ads are among the lowest 20% of ads competing for the same audience.
Obviously you never want to be in the bottom percentile, so if you see your ads have fallen into this category, try a few of the following tips:
- Reevaluate your audience. Think about the content you're sharing and where your audience is in the consideration and sales funnel. Is there alignment? Typically, you wouldn't serve a cold audience an ad to purchase. You’d likely start with an awareness or consideration campaign that speaks to their pain point and how your product or service was designed to solve for that problem.
- Use high-quality creative. There are so many ads being promoted on Facebook and Instagram. You need to stand out and not get scrolled over. Make sure the image you use is a high-quality, high-resolution image that ties in well with your copy and has emotional appeal.
- Check your frequency. If your frequency metric is getting too high, it can mean you are experiencing ad fatigue (the same people seeing your ad over and over and not taking action) and can have a big impact on your overall scores.
Are you also a social media advertiser? Have additional tips to share? Comment below with what you're seeing and ways you're optimizing your Facebook ad campaigns.