by Joseph Freeman | Updated Nov 9, 2021
When it comes to full-funnel digital marketing software that encompasses tools for creating content, running ads, and analyzing what’s happening all under one hood...
HubSpot really takes the cake.
It includes ever-evolving solutions for sending emails, automating drip nurturing campaigns, building landing pages, designing CTAs, segmenting contacts, and automating sales sequences and marketing workflows. It’s got it all.
But, the HubSpot dashboards don’t come out-of-the-box setup in a way that’s very useful!
They come pre-populated with high-level reports for things like:
- Top Landing Pages
- Top Emails
- Top Personas
- Etc.
These are okay for monitoring content, but I like creating a specific “Content” dashboard and moving those there (which requires HubSpot marketing Pro). When I log into HubSpot I want my main marketing dashboard to tell me the health of my contacts and lifecycle funnel at a glance. I need to know at a high level where in my omni-channel world I need to focus my attention each day.
Fortunately, you can build custom reports in HubSpot and add them to your default dashboard!
I’m going to explain the exact dashboard we at Digitopia set up for every HubSpot account we manage. AND, I’ll tell you why these reports matter.
But first, word of caution…
Dashboard reports are just the tip of the iceberg when it comes to reporting.
I may be preaching to the choir here…but, it’s worth mentioning. Don’t rely solely on these basic reports. They’re simply used as a navigational beacon to give you the very highest level data at a moment's notice. And, they point you to where you have problems that need attention and where to dig in.
HubSpot has many detailed and useful reports that are not covered here. To be an effective digital marketing manager you should be utilizing all of those tools (as well as Google Analytics, and Facebook, and LinkedIn, and, and, and…). The HubSpot dashboard is what I call a “Tower” report. Be on the lookout for my upcoming Tower vs. Cockpit Reports article.
So, how do you decide what to include in your HubSpot marketing dashboard?
Side note, each HubSpot tier has a set number of dashboards and reports you can create.
- Starter: 10 dashboards, 10 reports per dashboard.
- Professional: 25 dashboards, 20 reports per dashboard.
- Enterprise: 50 dashboards, 20 reports per dashboard.
That said, we want the best omni-channel view of how our digital marketing is performing.
Let’s start by breaking digital marketing down into 3 major categories
Branding
This is promoting the brand name and building a fanatical audience around it. Not a lot of immediate, measurable ROI here, but a MUST nonetheless.
Product
This is promoting specific products and services, and keeping the R&D going in order to continuously give your audience what they’re looking for.
Lead Generation
This is creating campaigns that actually drive traffic to landing pages that will convert visitors into an “owned“ audience, rather than just a pixeled audience.
- Owned audiences - you have contact info for these contacts which means you can reach out to them directly.
- Pixeled audiences - these have simply visited one of your pages and have therefore been “pixeled" by Google, Facebook, LinkedIn (or whatever you’ve added to your Google Tag Manager). So, for now, you can only reach them through paid ads.
The metrics we monitor daily at a very high level are:
Branding
- Reach
- Sessions/Traffic
- Branded keyword search
- Audience size/growth
Product
- Site search
- Non-branded keyword search
- Personas
Lead Generation
- Lifecycle counts
- New contacts
- New marketing qualified leads
- New sales qualified leads
- New opportunities
- New customers
- Lifecycle conversion rates
- Session to contact
- Contact to marketing qualified
- Marketing qualified to sales qualified
- Sales qualified to opportunity
- Opportunity to customer
- Lifecycle stage maturation and bottlenecks
- Source/channel attribution
- ROI
- Average days to close
- Campaign performance
Since we only get 10 reports on a board, and since HubSpot can’t totally accommodate all of these types of reports,
Here are the 10 reports we choose for our HubSpot Marketing Dashboard
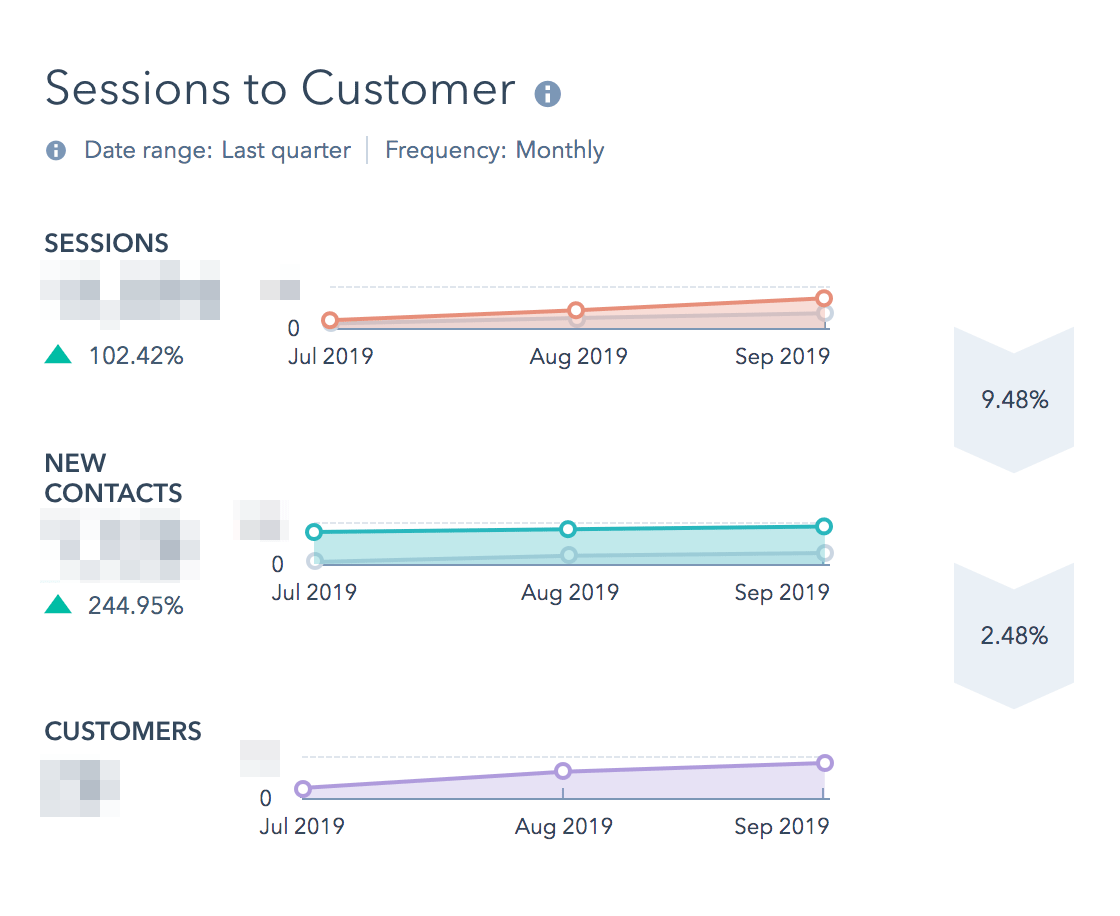
1. Sessions to Customer
This report shows us total sessions, new contacts, and new customers. With the right setup it can also show conversion rates between each of these lifecycle stages.
Why it’s important: We can quickly see the overall health of our funnel and a period-over-period comparison. This also allows us to pull conversion rates at any time for each stage for anyone who asks.
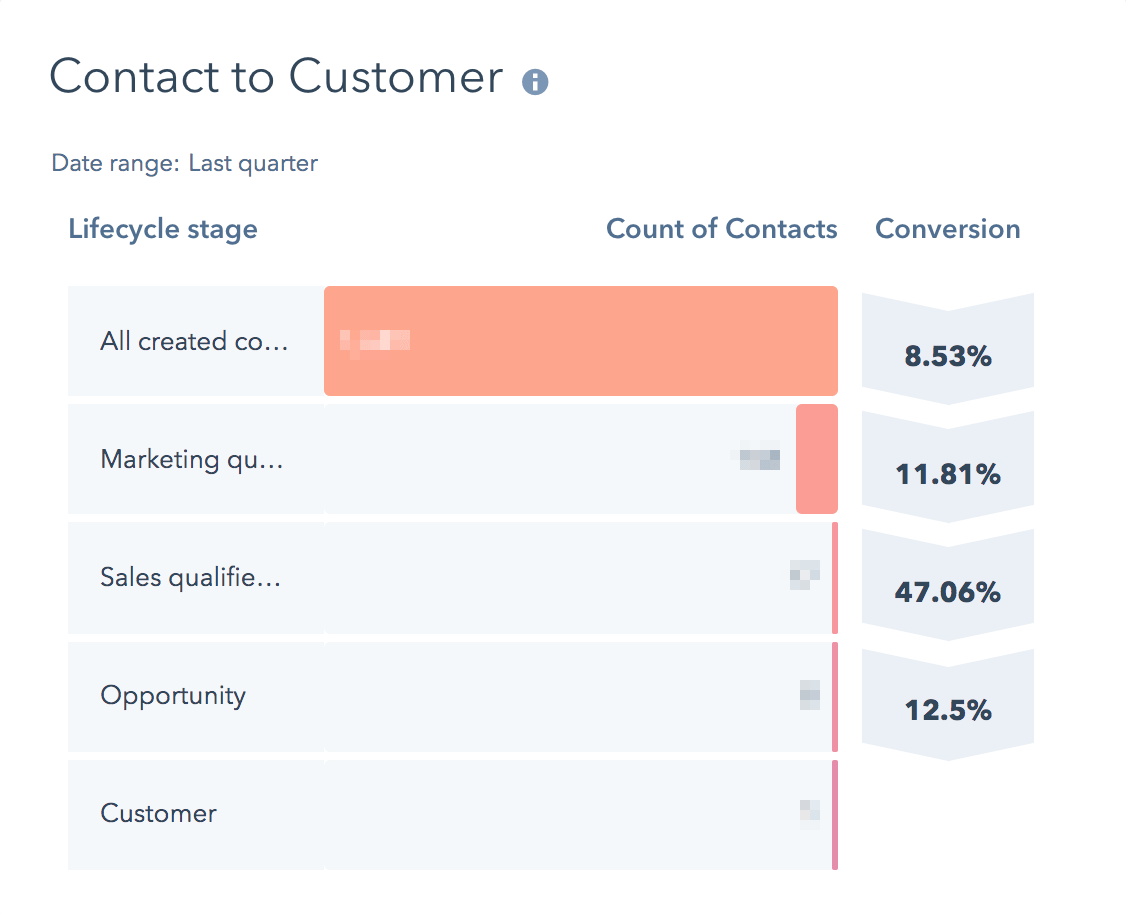
2. Contacts to Customer
This report supplements the first one to give a more granular breakdown of the journey through each lifecycle stage:
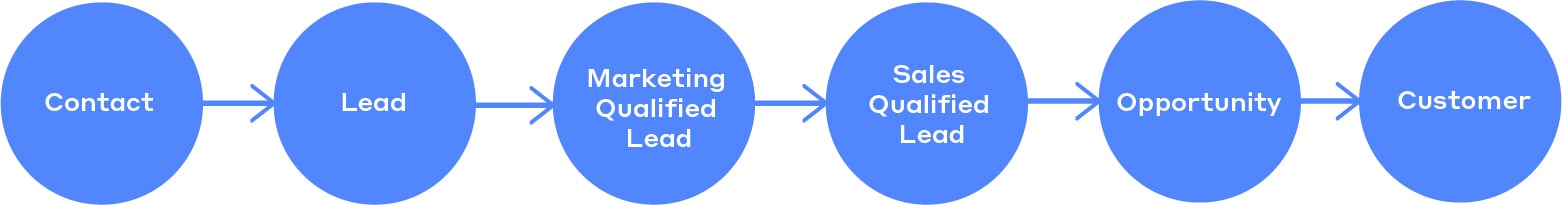
Why it’s important: Watching conversion rates at each lifecycle stage allows you to know where you need to spend your time optimizing. It also allows you to make more accurate revenue projections. By knowing the percentage of visitors that turn into each stage, you can pretty accurately let your executive and sales teams know what they should be expecting in terms of closed business and new revenue.
NOTE: What you are seeing here are contacts that have passed through EVERY stage included in the report. It will leave out anyone who, for instance, was converted from a “Lead” directly to an “Opportunity”. So it’s important that you have anyone managing contacts follow an agreed upon process when updating contact lifecycle stages. I’d recommend requiring everyone to set and save each lifecycle stage in succession. So, if you wanted to move someone directly from “Lead” to “Opportunity” you’d have to first set them to “Marketing Qualified”, save the record, then change it to “Sales Qualified”, save the record, and finally set it to “Opportunity”.
Cumbersome? Yes.
Overkill? Not if you care about accurate conversion rates.
So, between these two reports we’ve got sessions, lifecycle counts, and lifecycle conversion rates covered.
That’s a great start!
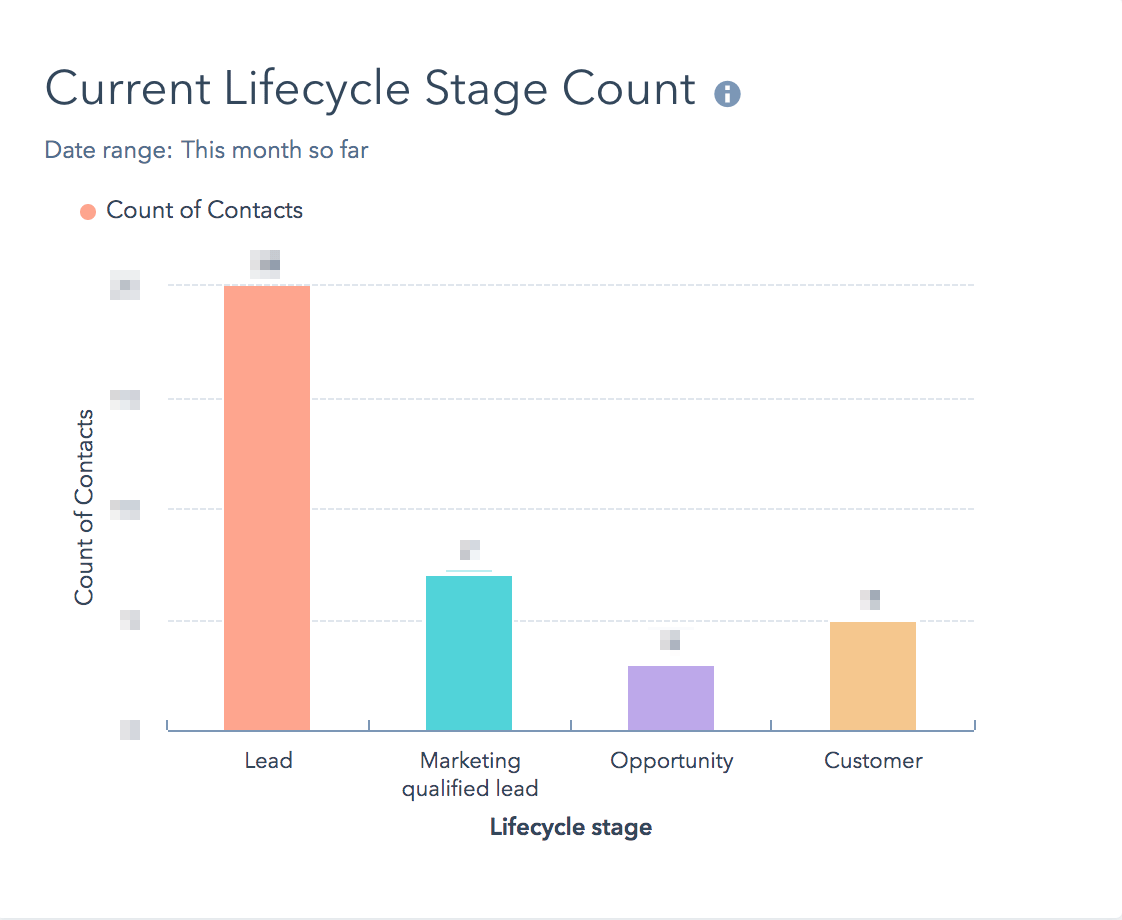
3. Current Lifecycle Stage Count
This is a bar graph showing how many contacts we have sitting in each lifecycle stage.
Why it’s important: When we see we have a disproportionate amount of “Leads” we know we need to run a deep dive content offer to this segment (learn about deep dive content in this article about The Digital Utopia Methodology). This will allow people to identify themselves as “Marketing Qualified”. If we see a lot “Sales Qualified” but low “Opportunities" we know we need to take a look at our Foot in the Door offer as well as have a conversation with our sales team to find out what’s going on.
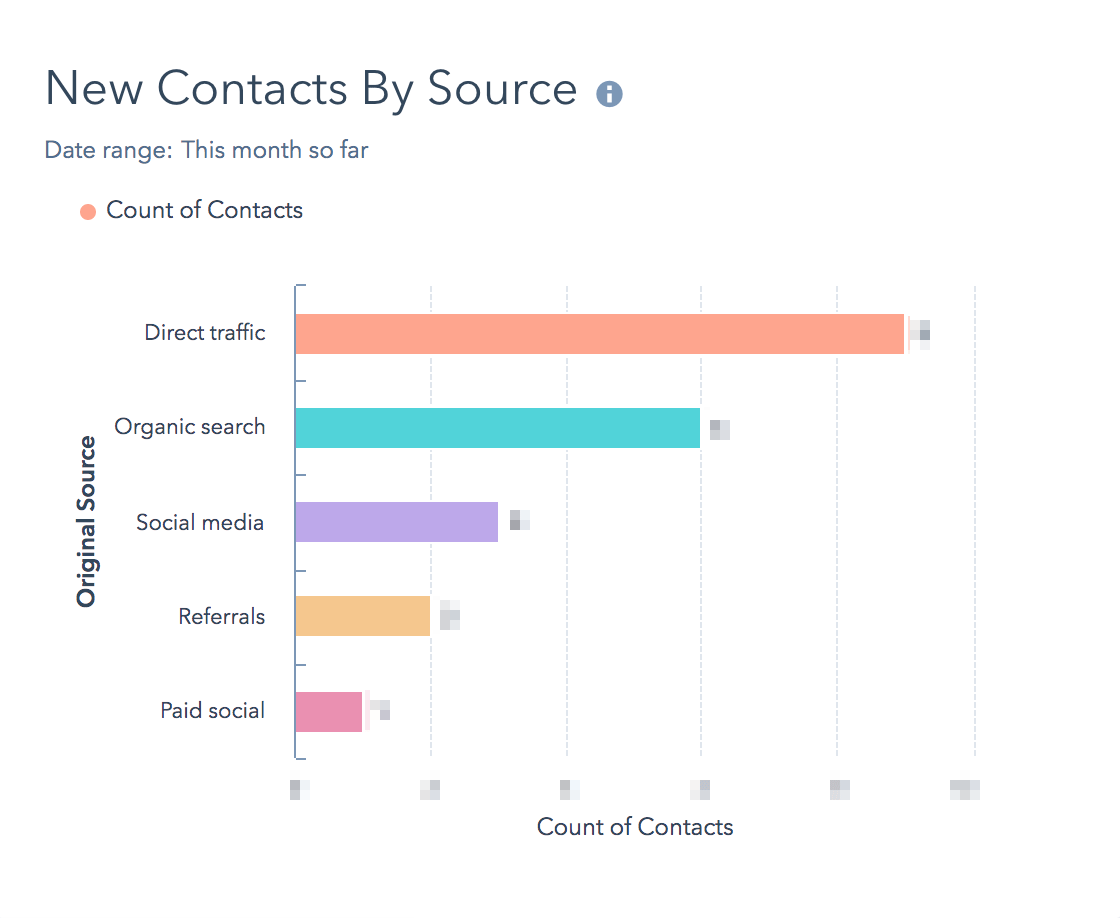
4. New Contacts by Source
This report shows which sources are creating the most contacts.
Why it's important: As a marketing strategist that's managing an omni-channel program, and often channel strategists, you don’t have time to look at everything everyday. You need something pointing you to where the problems and bottlenecks actually are. This report allows you to quickly see which channel is underperforming so you don’t have to waste your time diving deep on everything every day.
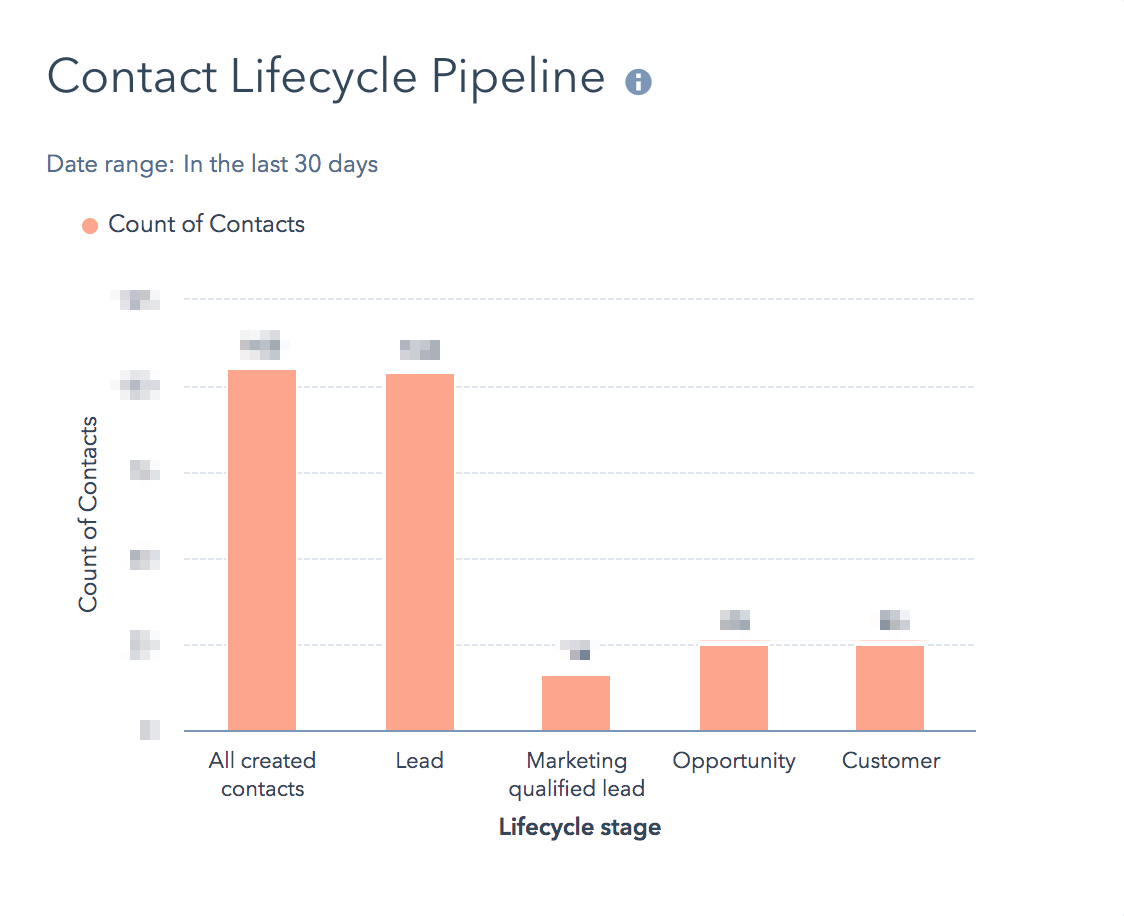
5. Contact Lifecycle Pipeline
This shows how many contacts moved through each lifecycle stage within a given date range.
Why it's important: Unlike our “Contact to Customer” report which only includes contacts that have passed through EVERY lifecycle stage, this one reports on those that have passed through ANY stage. They don’t have to move sequentially from one to the next in order to show up here. Additionally, many of HubSpot’s lifecycle reports only include contacts who’s “Original Creation Date" is within your date range. But that means that if someone is created in January and didn’t become a customer until June, when you pull your June report they will be excluded altogether since they weren’t actually created in June. Instead, this report includes contacts based on their “Became a…Date”. So, if they were created in January and their "Became a Customer Date" is in June, when you set your date range to June, they’ll show up.
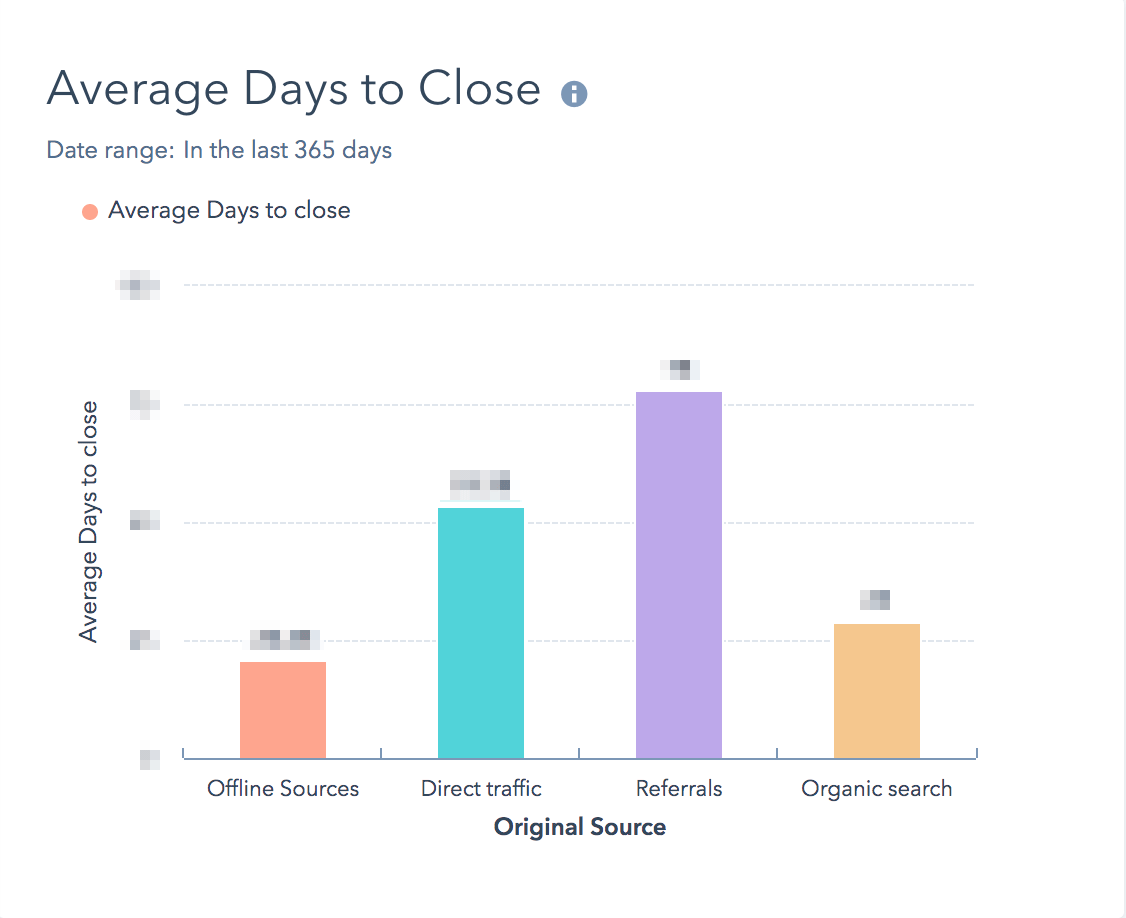
6. Average Days to Close
This shows the average days it takes a new contact record to get marked with a lifecycle stage of “Customer”. It’s broken down by source. Delicious!
Why it's important: Well, this is the whole name of the game…to close customers. And the quicker we can do it the better. This shows us which source/channel is producing the quickest wins. We focus our attention on optimizing the slowest one first. There is no good ROI report that can be added to the dashboard since HubSpot doesn’t know your all-in marketing spend (however, you CAN track ROI against your paid ads under Marketing > Ads). So, what we do here is:
- Take the average days to close number and set our dashboard date range to a time period that matches that. For instance, if our ADtC is 90 then we'll pick a time period that’s three months long. Let’s say January 1 through March 31.
- Add up all of our marketing spend (ad dollars, marketing department salaries, agency fees, software subscription costs, etc.) during that time and divide it by the customer count found in the aforementioned Contact Lifecycle Pipeline report. This gives us a number that’s close enough to trust.
Measuring ROI across many campaigns, many channels, and many months is really hard and almost always inaccurate. So, you just have to pick some method and stick to it, record your monthly numbers in a spreadsheet, and watch for up/down trends.
NOTE: Out of the box this report is set to pick up contacts created within the last 30 days. Since most B2B companies have buying cycles much longer than 30 days we like to customize this one to show contacts created within the last 365 days.
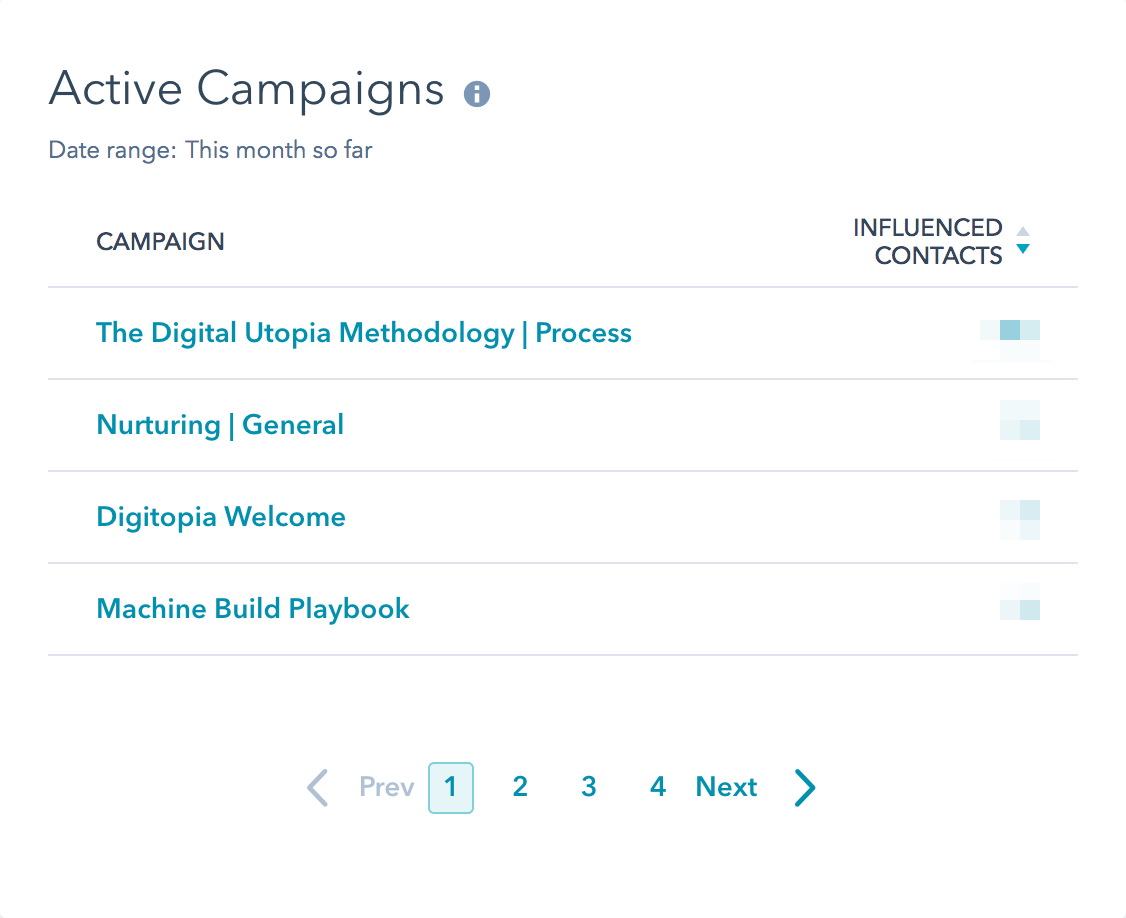
7. Active Campaigns
Yep. Just what it sounds like. It shows all of the active campaigns you’ve setup under Marketing > Planning & Strategy > Campaigns.
Why it's important: We like to create 1 HubSpot campaign for each content funnel using the Digital Utopia Methodology (read about building amazing content funnels here). So, this report shows me which of those content funnels are influencing the most contacts. Great for planning upcoming quarters’ content.
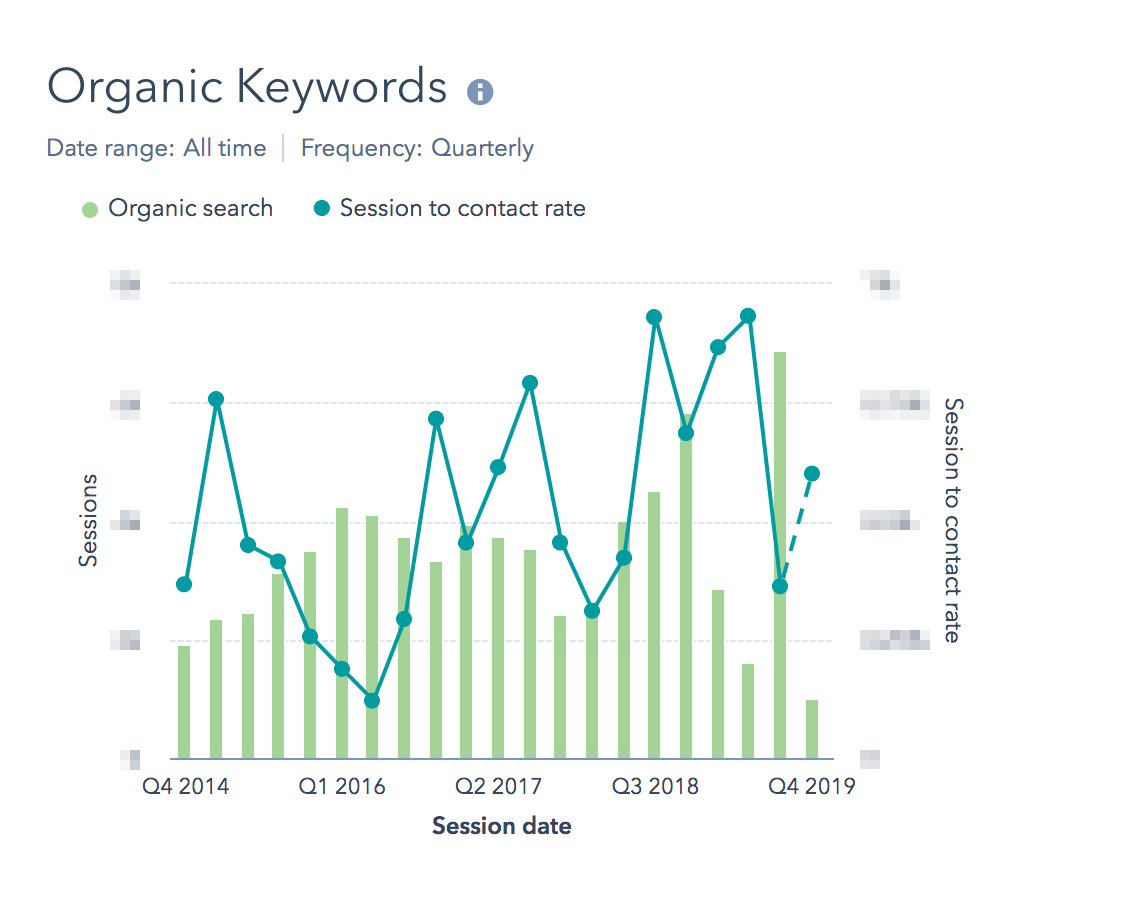
8. Organic Keywords
This report shows us what keywords people are searching to find us. At a top level you can see how much organic traffic you’re getting. By clicking in, you can see a breakdown of keywords and some related metrics, including how many contacts and customers they’re responsible for generating.
Why it's important: This gives us a good understanding of pain-point related keywords to help us mature our buyer personas. It also allows us to collect branded keyword counts which is one piece of the puzzle in understanding whether or not our general brand awareness and reach are climbing or declining.
NOTE: This report can’t be found in the “Add Report” button. You have to first run it under Reports > Analytics Tools > Traffic Analytics. To create the report be sure you have selected the "Combination" style of report. Once you have the report set to your specifications, choose to “Save as report” to add it to your dashboard from there.
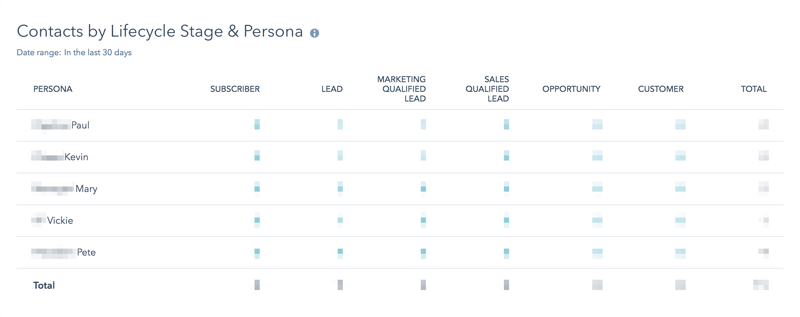
9. Contacts by Lifecycle Stage & Persona
This report shows all of the personas you’ve setup in HubSpot and the count of contacts in each. It also breaks it down by lifecycle stage.
Why it's important: At Digitopia, we create new Digital Utopia Experiences (content funnels) each quarter (learn how to create content funnels that actually work here). Each experience is built specifically for one buyer persona and is hyper-focused on just one of their pain points. This report helps us monitor which buyer persona needs some love and which level of the content funnel could use a fresh offer to get them moving again.
NOTE: There is a separate buyer persona report that allows you to click in and edit the persona. This dashboard doesn’t have room for that, but from time to time you’ll likely want to do that. Just put it on another dashboard for easy access.
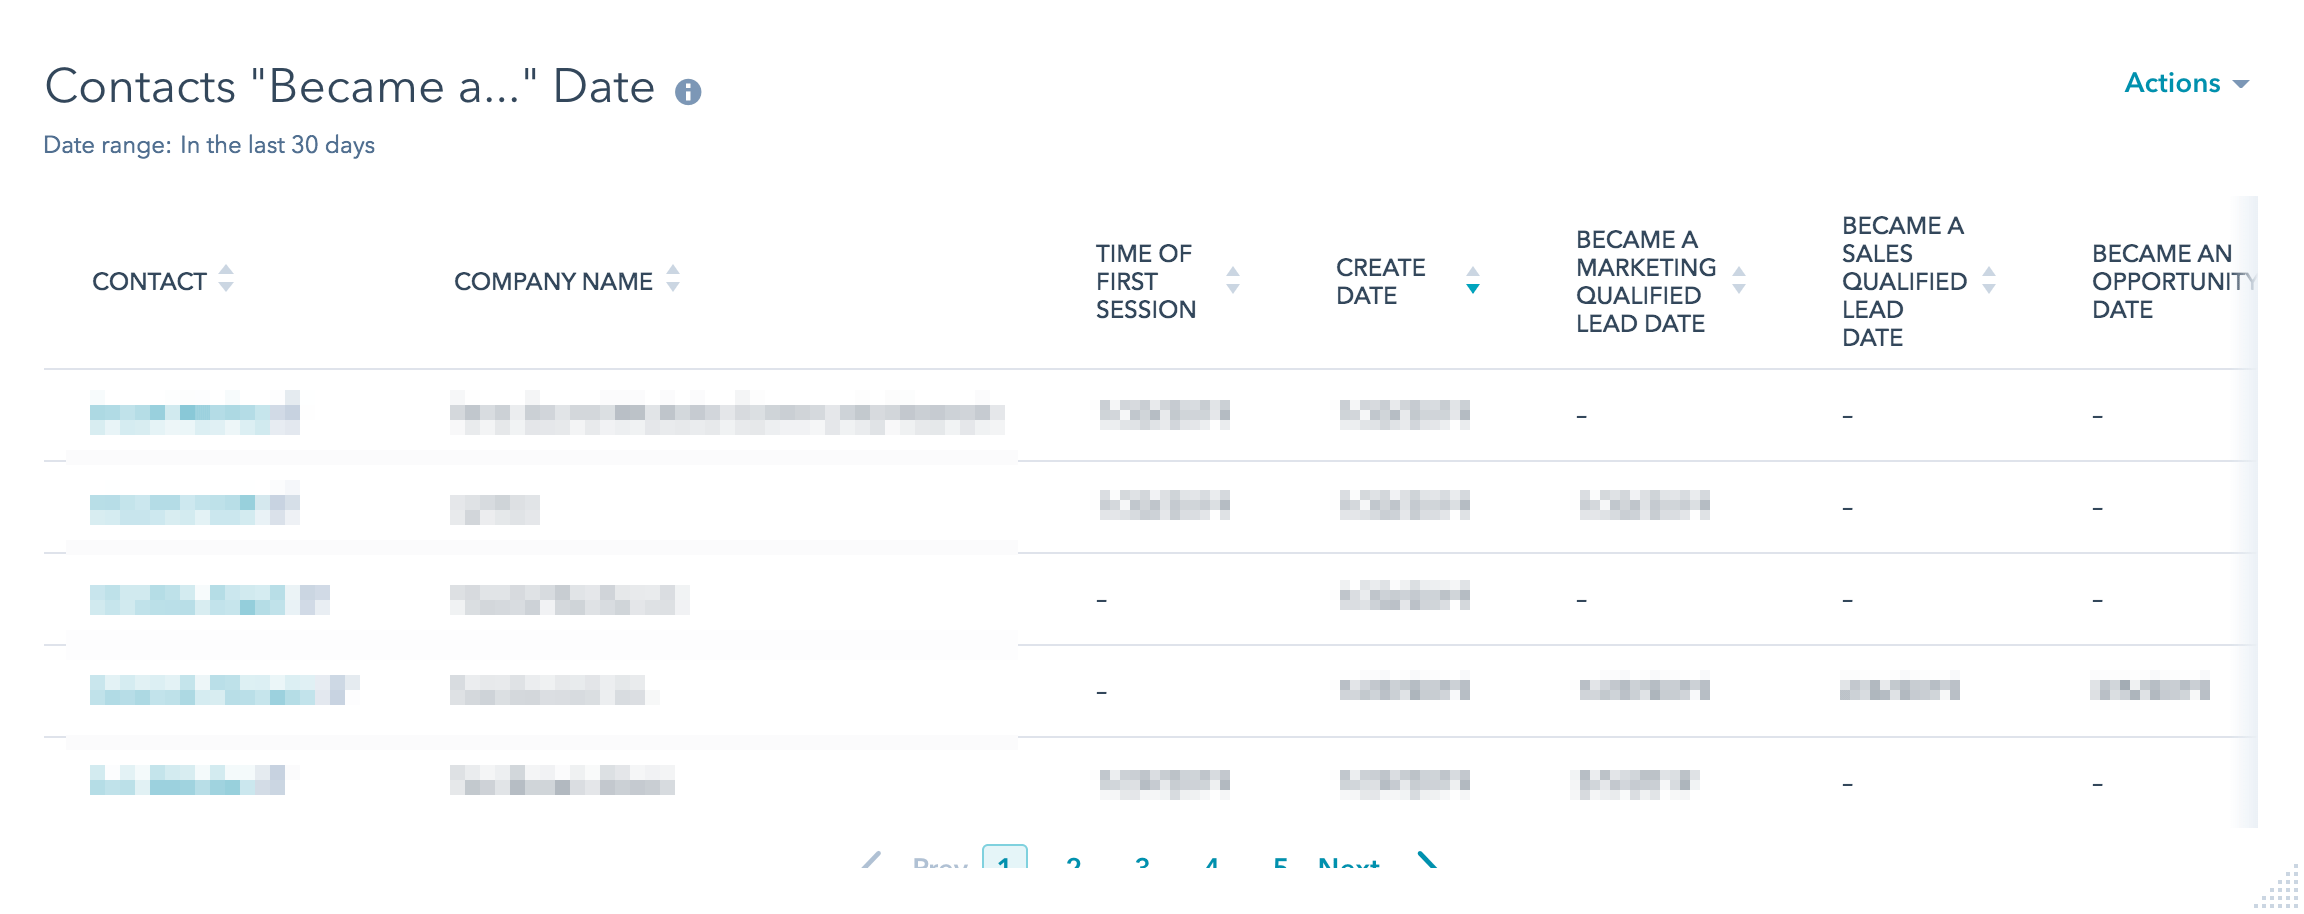
10. Contacts by “Became a…” Date
This is a table with columns showing the dates each contact matured to the next lifecycle stage.
Why it's important: Once a month we do a deep dive on a couple contacts to understand their journey. We look for patterns to exploit and common pinch points to optimize. This report allows you to quickly sort by different “Became a…” dates so you can choose which contacts you want to explore. We also get asked by our clients and our own sales team from time-to-time how long it took for certain contacts to mature through each lifecycle stage. This allows us a readily accessible answer.
NOTE: You can also setup saved filters in the Contacts > Contacts section which would display this same data, but we like to keep it handy on this dashboard. If you find that you need to free up a spot on this dashboard for something else, this would be the one to replace. Just go recreate this under Contacts > Contacts and you’ll have it just a few clicks away.
And, there you have it.
This is by no means a perfect dashboard. But it’s a really good dashboard. And in marketing we have to move quickly with “really good” knowing that we can always make it better.
So…move quickly. Go make your own “really good” dashboard. Right now.
If you need help tuning your dashboard or turning your website visitors into real sales opportunities, set up a time to chat with us!
We’re refreshingly good at it. Want proof?
See how we have helped teams unlock their HubSpot portal to be a revenue growth tool.